Randomization is useful for ensuring that students can answer the same material without having the same questions, and is also useful for creating multiple unique copies of a single question. This Tutorial will briefly discuss some of the basics behind using Randomization when writing exercises, and run through the process of creating an exercise with randomization step by step.
¶ Creating the Exercise
The first step is to create an Exercise. This is covered in the Creating Exercises section of the Getting Started tutorial. For this example, the Exercise will be a Homework Assignment.
¶ Editing the Exercise Settings
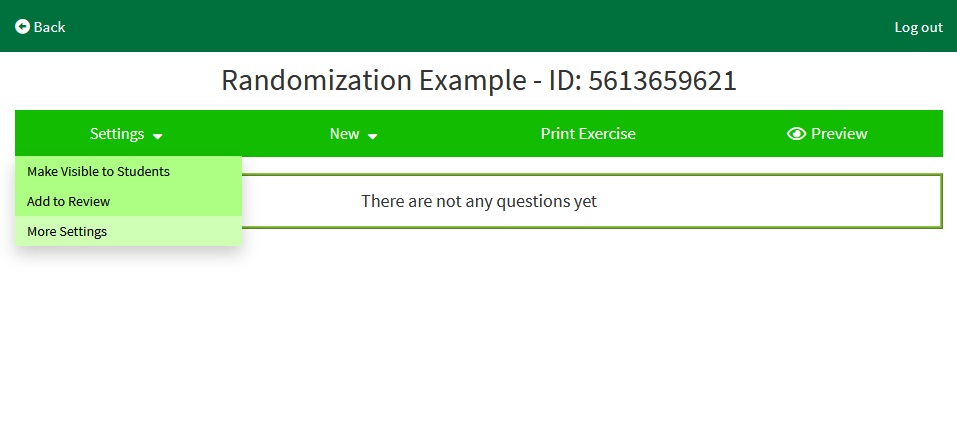
After creating your assignment, navigate to the Assignment Settings page by clicking on Settings → More Settings
In the Assignment settings Page, scroll to the bottom and check the following options
¶ Randomize Questions
This randomizes the order the questions are displayed in to students.
Should a student find out the answer to Question 2 from another student, for example, then they will get the answer to a different question.
¶ Randomize Answers
This randomizes the order of answers to questions that have multiple answers. The question types affected are Multiple Choice, Multiple Selection, Matching, and Categorizing Questions. Although Ordering questions also have multiple answers, they are always randomized, as sorting them is the point of the question.
In a Multiple Choice question the correct answer could be the second answer for one student and the forth answer for another student.
¶ Adding Question Pools
After setting the preferred settings in the Assignment Settings page, click Save and Edit Questions to return to the Edit page.
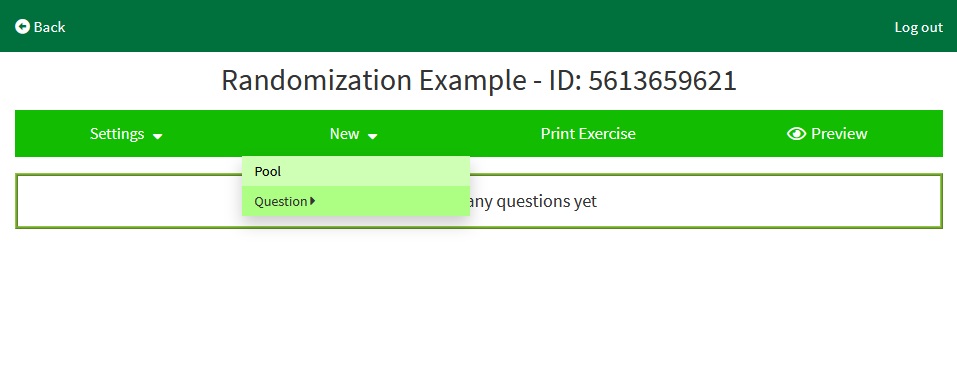
From there, navigate to the Pool page by clicking on New → Pool
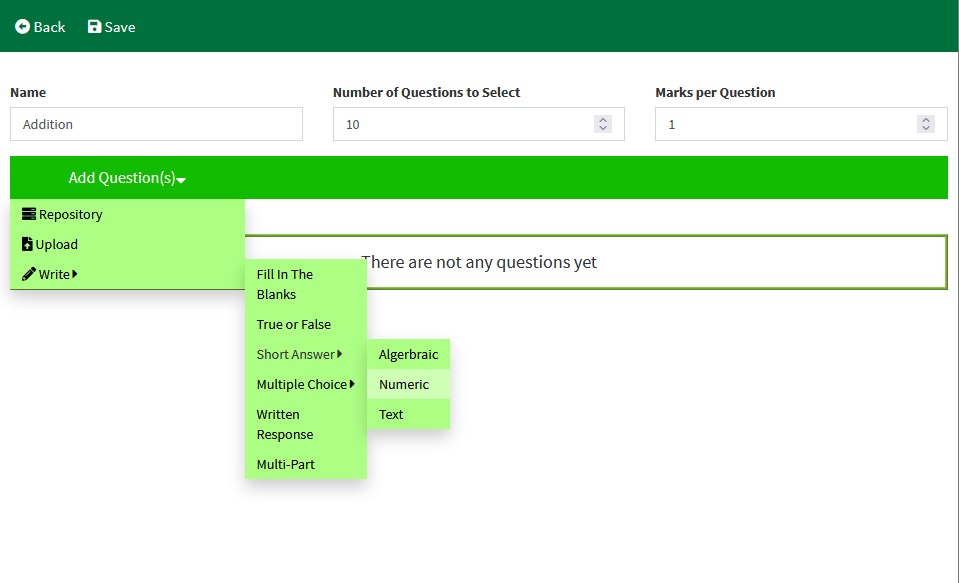
In this tutorial, the new Pool is named Addition, and there will be 10 questions to select.
¶ Numeric Answer Question
From the pools page, navigate to the Numeric Answer page by clicking Add Question(s) → Write → Short Answer → Numeric
This question will be an addition question, asking the student performing the assignment to add three numbers together.
Go to the Variables table and create three variables, called “a”, “b”, and “c”, each with a Min of 100, a Max of 999, and Digits of 0. All three will be three digit random integers that can differ from each other.
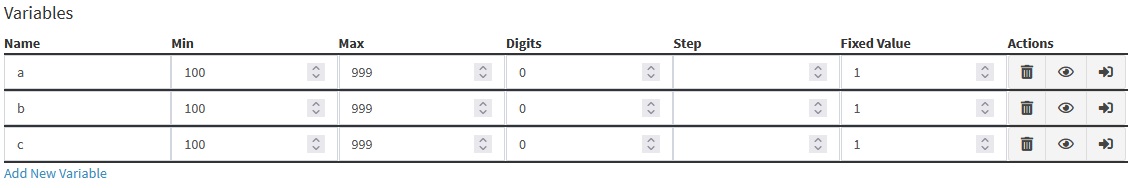
Each variable has 900 possible values it can take, making for a large number of unique but similar questions that this question can generate and a small chance for two questions to be the same.
Set the text in the Numeric Answer question input to “What is !{a} + !{b} + !{c}?”. When displaying the question, EduRITA will find the patterns !{a}, !{b}, and !{c} and replace them with the variables a, b, and c respectively. To put any variable or formula in text that will be displayed, write down its name surrounded by !{ and }.
Include a Correct Answer, set the Number of Correct Answers to 1, and in the table beneath the Order Correct Answers setting, set the Correct Answer to a+b+c. The Correct Answer for Numeric Answer questions is a formula, so the variable names are not surrounded by !{ and }.
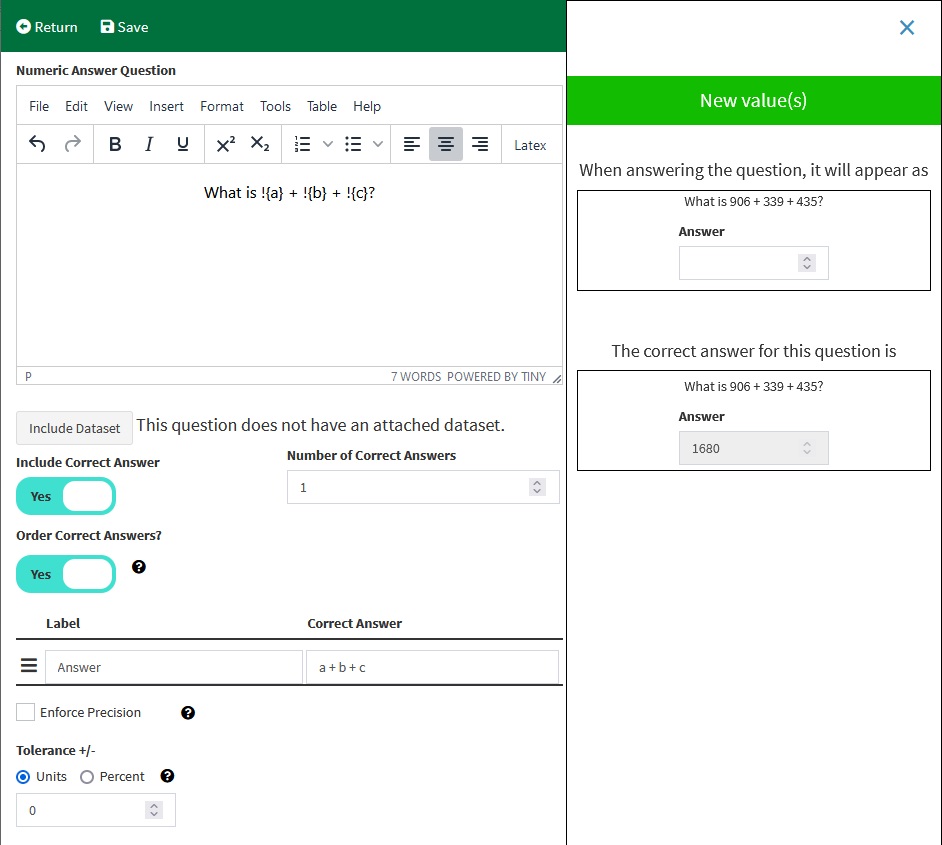
The New Value(s) button can be used to cycle through some possibilities for how the question can look.
Provide a label of your choosing to the correct answer, save the question, and then return to the Edit page.
From here, you can preview the exercise to see how selecting 10 questions from a pool of 1 looks.
¶ Fill in the Blanks Questions
Fill In The Blanks questions are one of the most versatile question types. It can support an arbitrary number of inputs, and the inputs can be placed directly into the question text.
¶ FITB example 1
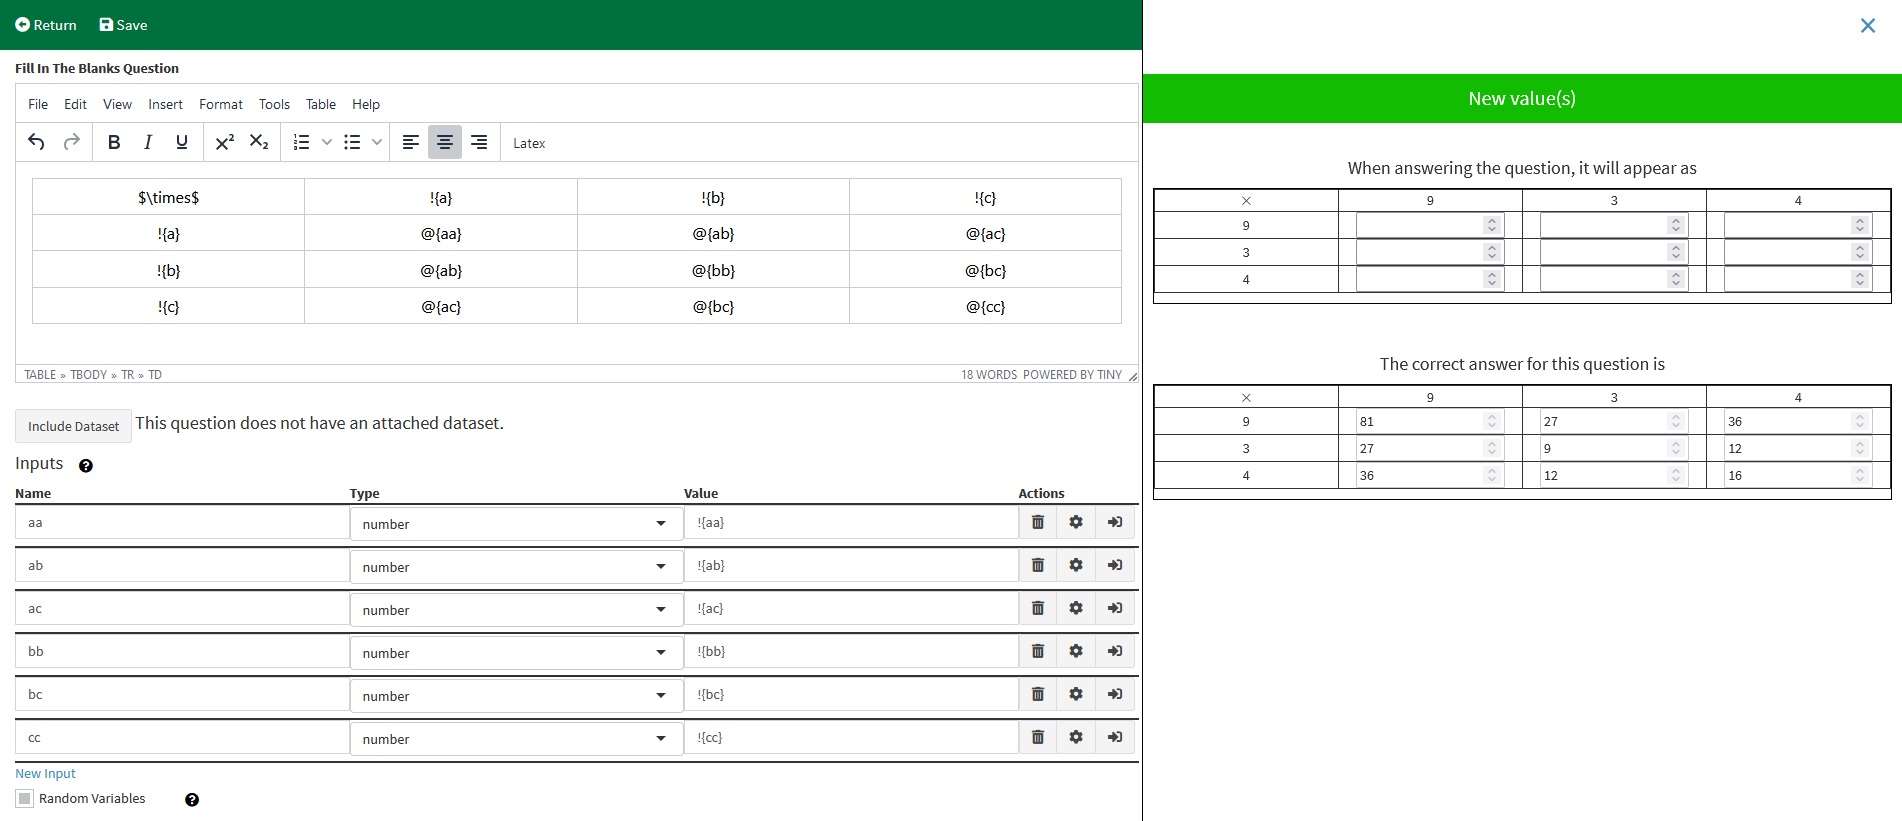
The next example will create a multiplication table in the Question editor for students to fill in. From the Edit page, create a new Fill in the Blanks question by clicking New → Question → Write → Fill In The Blanks
Create a table in the Fill In The Blanks Question Input by clicking Insert → Table → 4x4 or Table → Table → 4x4. This will create a table with 4 rows and 4 columns.

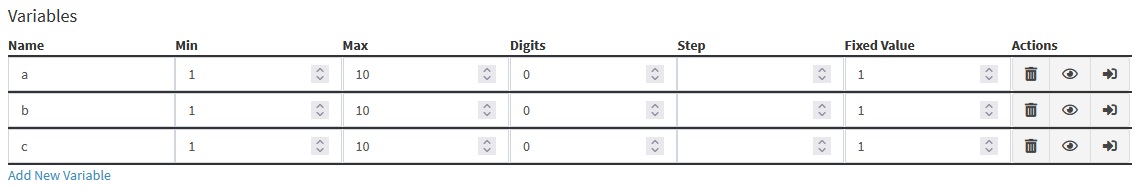
Once again, create three variables. This time, the variables in the example will range from 1 to 12, to randomly generate values that are commonly found on multiplication tables. The variables will once again be named a, b, and c, to keep the variable names short. These variables will be displayed in the top row and leftmost column
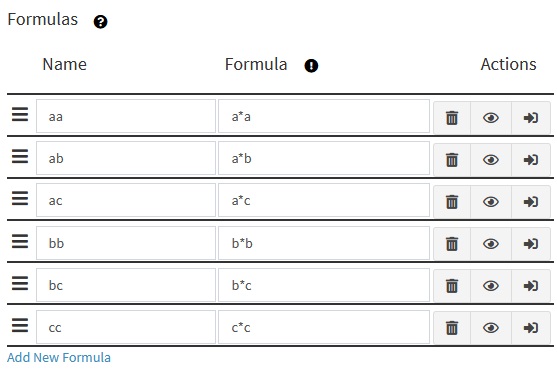
The table's contents be inputs, where the student enters the product of the variable in the row and column of the input. There are 9 inputs that will be added, but there are only 6 unique products. Create 6 formulas to calculate the correct answers.
Every Fill in the Blanks question requires at least one “Blank” to be filled in. These are created in the Inputs table. Create one input for each formula. For this example, each input has its type changed to “number”, and the settings are not changed.
By default, number inputs are not treated as formulas, so the value for each input is the name of the formula, surrounded by !{ and }.
Now, insert the variables and inputs into the table. To Insert a variable, type the variable name surrounded by !{ and }. To insert an input, type the input surrounded by @{ and }. In this example, the individual cells were changed to align in the center, and the top left cell contains $\times$. EduRITA supports latex in math mode when rendering questions.
After reviewing your question, save and then return to the Edit page.
¶ FITB example 2
The following example will display randomization by using more complex formulas. This question is based off of Question 4.8 in the textbook OpenIntro Statistics, 4th Edition by David Diez et. al.
In the Edit page, create a new Multipart question by clicking New → Question → Write → Multi-Part
This is the original question, transcribed from the textbook.
4.8 CAPM. The Capital Asset Pricing Model (CAPM) is a financial model that assumes returns on a
portfolio are normally distributed. Suppose a portfolio has an average annual return of 14.7% (i.e. an
average gain of 14.7%) with a standard deviation of 33%. A return of 0% means the value of the portfolio
doesn’t change, a negative return means that the portfolio loses money, and a positive return means that
the portfolio gains money.
(a) What percent of years does this portfolio lose money, i.e. have a return less than 0%?
(b) What is the cutoff for the highest 15% of annual returns with this portfolio?
To add randomization to this question, we will replace some of the numbers in this question with random variables.
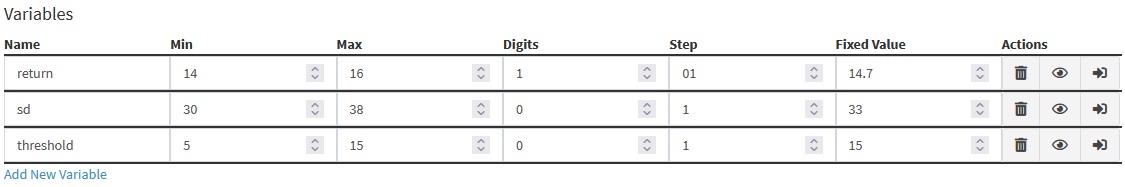
The first variable will represent the annual average return. In this example, it will be given the name “return”, a Min of 14, a max of 16, a Digits of 1, a Step of 0.1, and a Fixed Value of 14.7, to represent the original value.
The second variable will represent the standard deviation of that return. In this example, it will be given the name “sd”, a Min of 30, a max of 38, a Digits of 0, a Step of 1, and a Fixed Value of 33, to represent the original value.
The third variable will be for the 15% in part (b) of the question. In this example, it will be given the name “threshold”, a Min of 5, a max of 15, a Digits of 0, a Step of 1, and a Fixed Value of 15, to represent the original value.
Now replace the number with the corresponding variables, and add the text to the Preamble of the question.
The Capital Asset Pricing Model (CAPM) is a financial model that assumes returns on a portfolio are normally distributed. Suppose a portfolio has an average annual return of !{return}% (i.e. an average gain of !{return}%) with a standard deviation of !{sd}%. A return of 0% means the value of the portfolio doesn’t change, a negative return means that the portfolio loses money, and a positive return means that the portfolio gains money.
The questions (a) and (b) will be put in the Question inputs of their respective parts. EduRITA will combine them together when presenting the questions to the students during their exercises.
¶ Part (a)
From the Multipart question page, create a new Fill in the Blanks question by clicking Add Part(s) → Write → Fill In The Blanks
EduRITA will automatically save the Multipart question before navigating to the Fill in the Blanks Question writing page, but there is also a save button in the top of the page to save your progress while writing the question.
The question will already have the variables you wrote in the Multipart question page, and the preamble that was just written will be visible in the preview sidebar on the right.
For this example, the answer will be rounded to 2 decimal places. So the question is changed to the following
What percent of years does this portfolio lose money, i.e. have a return less than 0%?
@{answer}% (round to 2 decimal places as needed).
@{answer} is going to be where the input for the correct answer is placed. In the preview, it will appear as @{answer}, and then be replaced with an input once the input is created.
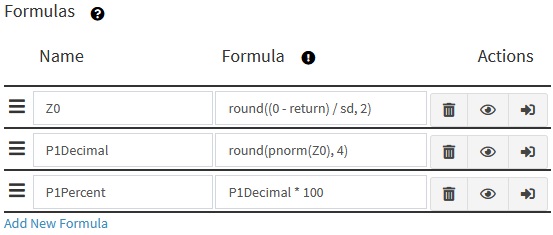
The correct answer will change depending on what random values the variables generate. This can be calculated using the Formulas table below the Variables table. This example will use 3 formulas to solve this question.
The first formula will be named Z0, and will calculate the Z score for 0. In the formula column, enter “round((0 - return) / sd, 2)”. round is an R function, It will round the first argument, to the number of digits specified in the second argument, or to the nearest integer, if no digits are specified. For more information on the function, click the exclamation mark button next to the “Formula” column header, and search for the function “round”. round is in the “Math” function group in the documentation.
The second formula will be named P1Decimal, and calculates the correct answer for part 1 of this question. enter “round(pnorm(Z0), 4)” in the formula column. pnorm is an r function for calculating the normal probability distribution function. More detail about the pnorm function can be found in the R documentation by clicking the exclamation mark. It is in the Statistics function group.
The third formula will be named P1Percent, and converts the answer to a percentage, the format the question asks for. Enter “P1Decimal * 100” in the formula column.
Formula Z0 is being used as a variable in formula P1Answer. When being evaluated, formulas are added to the R environment one at a time, from top to bottom. Having a formula depend on another formula is useful for keeping the formula length short, making it easier to read. In order to do so, the formula being used must be above it on the table, so it is defined first. If a formula depends on a formula below it in the table, you can fix the issue by clicking the bar icons and dragging the formulas to reorder them in the table.
Solutions can be added to question parts, showing students how the answer is calculated when it is made available by the exercise settings. Solutions support Latex math mode and variable substitution. Here is the solution for this question
Let $X$ denote returns on this portfolio, then $X ∼ N(μ = !{return},σ = !{sd})$.
$P(X <0) = P(Z < \frac{0 - !{return}}{!{sd}}) = P(Z < !{Z0}) = !{P1Decimal} \rightarrow !{P1Percent}$%
P1Decimal is calculated as a separate formula so it can be displayed in the solutions, even though it is not used in the question or correct answer.
With the correct answer calculated, create an input named “answer”. Set its type to number, and set the value to !{P1Answer}. Save the question, and return to the Multipart question writing page.
¶ Part (b)
From the Multipart question page, create a new Fill in the Blanks question by clicking Add Part(s) → Write → Fill In The Blanks
Similar to when creating part (a), the preamble and the variables will be visible on this page as well. The Formulas just created will also be visible, but the inputs will not.
Variables, Formulas, and Datasets are shared by all parts of a question, but inputs are unique to each question part.
For this example, the answer will be rounded to 2 decimal places as well, and 15% will be replaced by the variable “threshold”. So the question is changed to the following
What is the cutoff for the highest !{threshold}% of annual returns with this portfolio?
@{answer} (round to 2 decimal places as needed).
Since inputs are not shared between question parts, this “answer” input will be different from the previous one, and the same naming convention can be used.
Three more formulas will be used to calculate the correct answer to this question.
The first of these formulas will be called “Percentile”, and will calculate the percentile needed for the correct answer. Its formula is “100 - threshold”
The second of these formulas will be called “Quantile”, and will calculate the quantile needed for the correct answer. Its formula is “round(qnorm(Percentile / 100), 2)”. qnorm is an R function for calculating quantiles for the normal distribution.
The third formula will be called “P2Answer”, and calculates the correct answer for this question part. The formula is “Quantile*sd+return”.
The solution for this question part is
The Z score corresponding to the top !{threshold}% (or !{Percentile} percentile) is !{Quantile}.
$Z = !{Quantile} = \frac{x-!{return}}{!{sd}}→ x = !{Quantile} \times !{sd}+!{return} = !{P2Answer}$
This completes the question. Save, return to the Multipart question page, and then return to the Edit page to write the last question.
¶ Multiple Selection Question
The last example a simple demonstration of preparing a question that has answer pooling enabled.
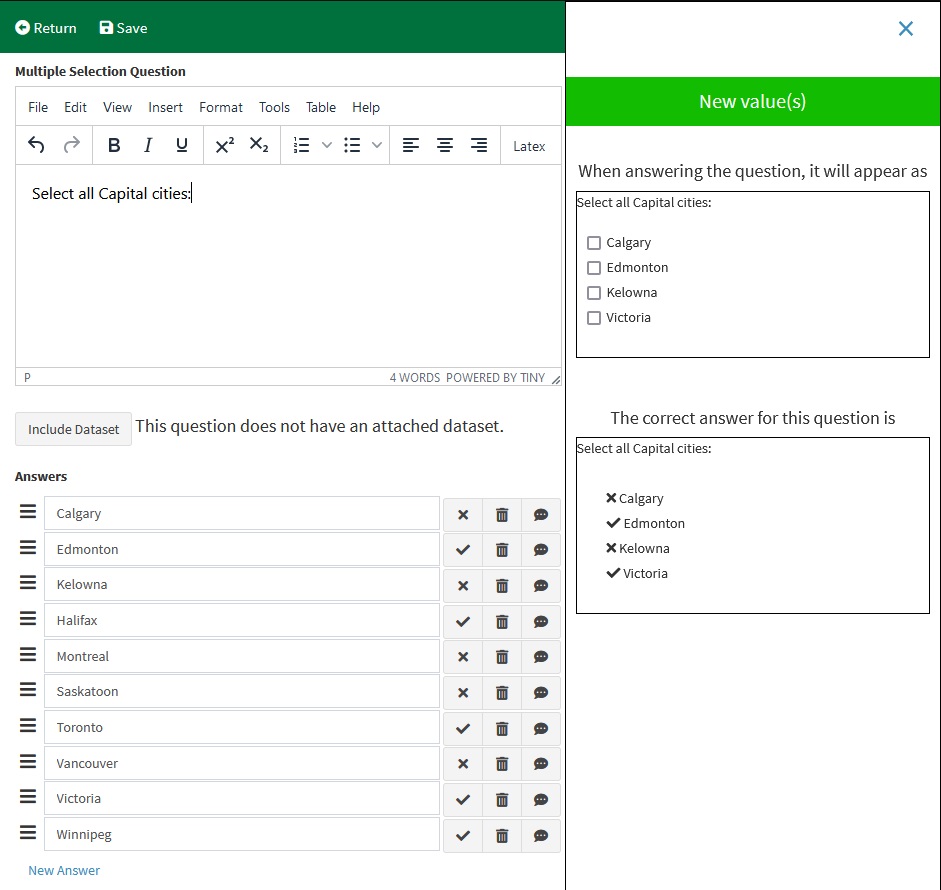
From the Edit page create a new Multiple Selection question by clicking New → Question → Write → Multiple Choice → Multiple Selection
The Question text for this example is “Select all Capital cities:”. The answers are: Calgary, Edmonton, Kelowna, Halifax, Montreal, Saskatoon, Toronto, Vancouver, Victoria, and Winnipeg.
In the settings, check the option “Pool Answers”. Set # Answers to 4, and # Correct Answers to 2. With these settings EduRITA will randomly select 4 answers from the 10 that are given, and make sure that 2 of them are correct.